
Joshua DuMont
Polar graphs of the
form r=a+bcos(kΘ)
Polar graphs like r=a+bcos(kΘ)
have several interesting properties we can look at. First,
the value of k affects the period of the graph. The idea that y=cos(kx) has values that will repeat every ![]() is familiar. This looks somewhat different in
polar coordinates. Let’s look at r=3+2cos(6Θ)
to see what that means.
is familiar. This looks somewhat different in
polar coordinates. Let’s look at r=3+2cos(6Θ)
to see what that means.
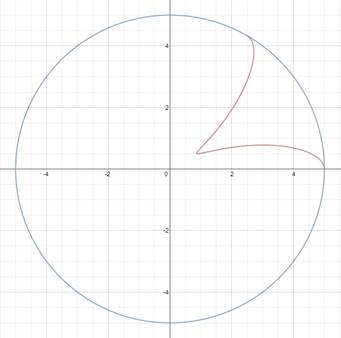
As ![]() ,
r (the distance from the origin) is shrinking. As
,
r (the distance from the origin) is shrinking. As ![]() ,
we see r increase to its maximum again. We see the same decrease from maximum
increase back to maximum pattern over the period we are used to, but the
heights are now distances from the origin and the period is an angular section
of the plane. Notice that if we draw the graph over six periods we return to
where we started in the plane and begin to trace the same path over again.
,
we see r increase to its maximum again. We see the same decrease from maximum
increase back to maximum pattern over the period we are used to, but the
heights are now distances from the origin and the period is an angular section
of the plane. Notice that if we draw the graph over six periods we return to
where we started in the plane and begin to trace the same path over again.
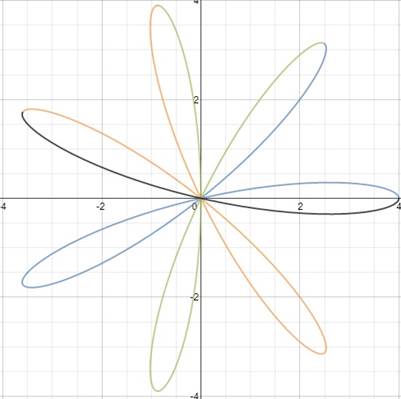
After k repetitions we will end where we started, Θ=k ![]() .
For integer k values this means the r value will be the same, and a k-leaf rose
will be formed. Rational values for k result in r values not lining up at Θ=0
and Θ=
.
For integer k values this means the r value will be the same, and a k-leaf rose
will be formed. Rational values for k result in r values not lining up at Θ=0
and Θ=![]() .
They will, however, line up at multiples of
.
They will, however, line up at multiples of ![]() multiplied by the denominator of the fraction
k. For example r=3+2cos(
multiplied by the denominator of the fraction
k. For example r=3+2cos(![]() Θ)
repeats every
Θ)
repeats every ![]() instead of every
instead of every ![]() .
Also
note that the denominator of the fraction still gives the number of rose leafs.
.
Also
note that the denominator of the fraction still gives the number of rose leafs.
We
know that cos(Θ) always returns a value between -1 and 1. So, r=a+bcos(kΘ) has amaximum r value of a+b and a minimum r value
of a-b.
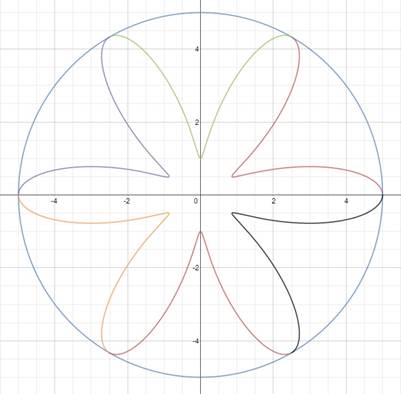
For instance,
r=3+2cos(5Θ) is always between the circles r=1
and r=5
If the a and b values are the same then the leaves meet
at the minimum value r=a-a=0
If a<b we run into the situation where a-b is a
negative number. On the graph this means we turn a positive angle Θ and
instead of moving out along the terminal side of the angle we move along the
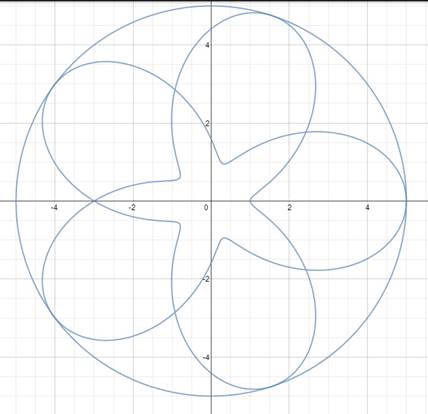
extension of the terminal side on the other side of the origin. Let’s look at r=1+2cos(5Θ) for an example.
When![]() ,
we get that r=1 and r continues to be positive until
,
we get that r=1 and r continues to be positive until ![]() =
=![]() when r=0 (blue). The r value is then negative
on
when r=0 (blue). The r value is then negative
on ![]() <
<![]() <
<
![]() (orange).
(orange).
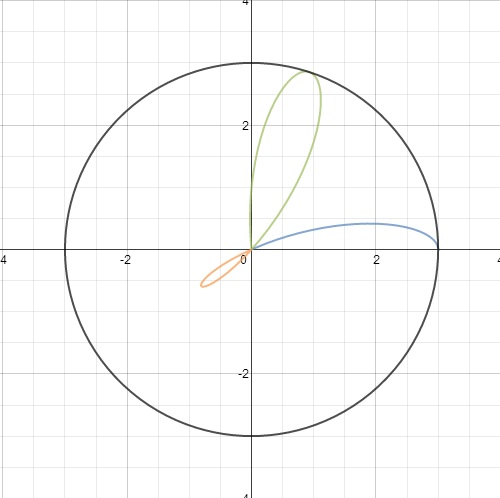
The graph continues in this manner, and we end with a graph with
a large rose inside r=3 and a small rose inside r=-1 (note this is the same
graph as r=1).
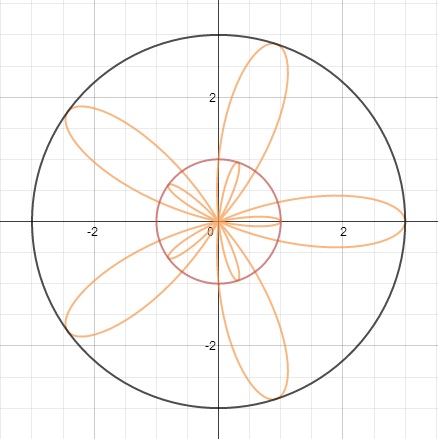
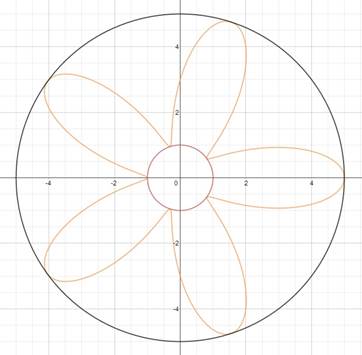
The situation is the same for r=bcos(kΘ)
(a=0). The a value is less than the b value. So we
sometimes get negative r values, but now the minimum r value is –b and the
circles enclosing circles are the same. So the negative portions will overlap
the positive portions of the graph. The following graph shows r= 4cos(7Θ) and its first three and a half cycles.
Notice that the graph has negative sections for half of
each period and that the second half of the third period will start to retrace
the previous portions of the graph. We end with a seven leaf rose that has been
traced over twice as much.